![]() 817.332.6400
817.332.6400

Citi Global Wealth Investments
CIO Strategy Bulletin | September 17, 2022
If you are experiencing difficulty viewing this email, please view the PDF version.
SUMMARY
- Markets are deeply unsettled. Through the remainder of 2022, we expect US employment to be positive, profits to marginally grow further, and inflation to start slowing. However, we also expect a likely 10% decline in US corporate earnings for 2023. A rapid "change of weather" for the economy appears on the horizon.
- We have changed our scenario weightings to 10% Robust, 20% Resilient and 70% Recession.
- The Fed is fighting inflation with a potent combination of higher interest rates and Quantitative Tightening. They are moving very quickly, so fast that the impact of their tactics is not apparent, yet. The Fed’s speed will also diminish its ability to counter policy mistakes.
- In this Bulletin, we cover what we have not seen yet, the forward impacts the Fed may have across industries and the broader economy. Our purpose here is to prepare investors for what is likely to come in the next six months and help them avoid shock. The rough end to 2022 and the likely uncertain entry for 2023 is a mere "moment" in the life of an investor’s portfolio. Our defensive actions for portfolios seek to help investors avoid making decisions that may negatively impact long-term wealth-building strategies.
Valuing the Unknowns
Financial markets performed exceptionally poorly last week. Tuesday brought news that the US Consumer Price Index went up by 0.1% in August instead of falling 0.1%, as expected. Core inflation measures rose by 0.6% on the month, vs expectations at half that amount. On that day, the S&P 500, Nasdaq and the Bloomberg Aggregate US Bond Index were down by 4.3%, 5.5% and 0.6%, respectively. By week's end, they were down by 4.8%, 5.5% and 1%. Why would such a small positive change in CPI cause such a large market decline?
There are many unknowns that markets cannot easily value. The most obvious of these is a possible recession, of undetermined length and breadth. Less obvious are the short and longer-term impacts of higher energy prices on European households and businesses, with near-term risks tied to Europe's weather this winter (please see our latest Quadrant). Commodity prices, residual supply shortages, the post-Party Congress direction of the Chinese economy and the outcome of the Ukraine war are other major market factors.
But of all these factors, the one most vexing markets is the Fed itself. With inflation appearing to run hot in the US, the Fed's rate and balance sheet actions are both bold and unprecedented. How high will rates go and how long will they stay there? How much tightening can the economy endure before credit costs rise and credit availability falls dangerously? In its experiment to drive down inflation and ensure that it does not become embedded in the US economy, the Fed's medicine will have intended and unintended consequences. Its ability to counter mistakes will diminish over time.
Our purpose here is to prepare investors for what is likely to come in the next six months and help them avoid shock. The rough end to 2022 and the likely uncertain entry for 2023 is a mere "moment" in the life of an investor's portfolio. Our defensive actions for portfolios seek to help investors avoid making decisions that may impact their long-term wealth-building strategies.
The Fed Has Put Markets on Edge
The Federal Reserve is determined to fight inflation urgently. It has two major tools to do so. The first is a conventional tool, raising short-term interest rates. Raising rates has the effect of increasing the cost of borrowing and of offering investors a higher risk-free rate, in effect causing them to consider holding short-term, low-risk instruments in lieu of making other, longer-term investments that are more helpful to grow the economy.
When a two-year bond yielded 0.2% in April 2020, it was not an attractive investment alternative. Today, at a yield of 3.85%, with both equities and bonds down for the year, it can attract significant investor inflows. The same goes for high-quality, short duration spread products, such as municipal bonds and corporates, with many trading at taxable equivalent yields closer to 5% (see our May 29 CIO Bulletin, "Why We Believe Bonds Are Back"). Right now, savers are also sending inflows into higher yielding money funds as yields eclipse the safest bank deposit rates.
A second tool is the Fed’s balance sheet. During extraordinary times, like the pandemic and the Global Financial Crisis, the Fed buys US Treasuries and government-backed mortgages and holds them on its balance sheet. This is known as Quantitative Easing. By buying bonds with "newly printed money," the Fed expands aggregate credit and improves market liquidity. With the Fed buying Treasuries and MBS, investor capital moves to other riskier instruments. When the Fed continues this for a long period, broader credit easing takes place, buoying economic growth and inflation.
Quantitative Tightening (QT) is the opposite of QE. The Fed sells its bonds or allows them to mature, reducing the amount of lending the Fed has provided to the economy. This means other buyers (investors) will need to make these loans and finance economic activity. By withdrawing its loans, the Fed reduces market liquidity and causes the cost of capital to rise. An example would be an increase in the "spread" one needs to earn to be attracted to buy a lower quality bond.
An Exceptional Bolus of Fed Medicine
The combination of higher interest rates and Quantitative Tightening is very potent. During the last Fed tightening cycle, the Fed raised interest rates 9 times over 3 years (25 basis points each time) and reduced security holdings by over $600 billion from January 2018 to mid-2019. That led to an equity drop of nearly 20% in Q4 2018. Only when the Fed pivoted to an easing stance did equity markets rise in response.
Markets and the economy are more vulnerable now than in 2018. At that time, inflation was still low, and the Fed felt it had the choice to support a longer period of employment gains. It was not actually trying to induce a recession, but instead believed it was "normalizing" monetary policy by simply being less accommodative.
Today’s tightening cycle is atypical. Here are three reasons why this is an unusual time.
- This coming week, the Fed is likely to raise its policy rate target by 75 basis points for a record third time. In the strong tightening cycle of 1994-1995, the Fed raised rates by 75 basis points only once. The rate hikes of the past four months would ordinarily unfold over an entire year. By tightening policies rapidly, there is a greater immediate shock to the economy. And all this is happening before QT measures are fully implemented.
- It is also unusual for the Fed to be tightening as labor markets improve. Now that economic growth has slowed and many areas of the economy – such as housing – have already begun to contract, the Fed’s continuation of tightening steps are likely to prove "pro-cyclical. This means they will exacerbate the weakness in the economy to come.
- Finally, tightening during a supply shock has become quite unusual for the Fed. The effects of the war in Ukraine will slow the global economy. Losses of energy supplies will be a continued drag. In cycles since the late 1980s, the Fed believed its credibility as an inflation fighter would allow it to accept temporary spikes in inflation. It would not tighten or even ease to help the economy absorb an external shock.
Risks Rising Quickly: Our Revised Scenario Weightings
The case for a "recession" or "stall" in the economy in 2023 is quite strong and rising.
We have revised our three scenarios accordingly. The chance of a ROBUST economy in 2023 is just 10%, the probability of a RESILIENT outcome is now 20% and the chance of RECESSION is 70%, in our view. This reflects the unpredictable nature of major events, some of which could unfold less negatively than we outline herein.
However, the Fed’s decision to fight inflation as if it were an entrenched problem certainly suggests the likelihood of a recession is akin to 1980. In that year, unemployment rose 2 percentage points. Similarly, we would expect 1-2 million net job losses in 2023, even as the labor force grows.
Fortunately, there are no industry "booms" to unwind such as those of the housing or tech bubble cycles circa 2000 and 2008. This suggests no need for a very deep retrenchment. And there is also no evidence to suggest inflation will have a "life of its own" during the slowing ahead. Both long-term inflation expectations and nominal wage gains are moderate. Thus, the Fed will be the "wild card" as only it can determine when to pivot to support what will be an ailing economy, if trends unfold as expected.
What We Have Not Seen Yet
How Far Will Housing Fall?
The speed of the Fed’s actions (rates and QT) is the "delivery of the medicine." The impact of that medicine is lower aggregate economic demand. What does lower demand in 2023 look like?
Because of how the mortgage market works, housing provides a clear example of the Fed's rate impact. The signs suggest that the downturn in housing will be substantial, but without the contagions of the housing bubble of 2008.
With mortgage rates having risen past 6%, the pace of new home sales has fallen 51%. In contrast, residential construction spending has only fallen 2% thus far. A massive decline in new home contract signings is only the beginning of the housing contraction (see figure 1).
Residential buildings take 6-12 months to complete. Right now, residential construction employment is continuing to rise to a new high, but it is highly likely to contract sharply in the coming year as housing projects are completed (see figure 2) and few new ones are started.
|
Figure 1: New Home Sales Contract Signings off 51% vs New Homes Under Construction -0.1% to-date 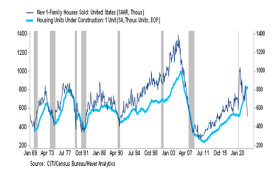
Source: Factset and Bloomberg through September 13, 2022. Grey areas note recessions. Indices are unmanaged. An investor cannot invest directly in an index. They are shown for illustrative purposes only and do not represent the performance of any specific investment. Past performance is no guarantee of future results. Real results may vary. |
Figure 2: New Home Sales vs Residential Construction Employment 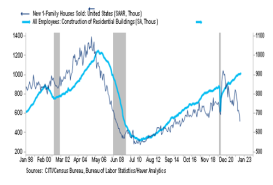
Source: Factset and Bloomberg through September 13, 2022. Grey areas note recessions. Indices are unmanaged. An investor cannot invest directly in an index. They are shown for illustrative purposes only and do not represent the performance of any specific investment. Past performance is no guarantee of future results. Real results may vary. |
|
Figure 3: Despite vehicles becoming more available, higher lending rates are stymying the market even as vehicles become available 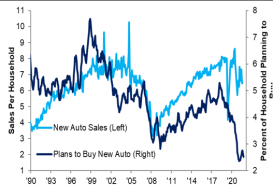
Source: Factset and Bloomberg through September 13, 2022. |
Figure 4: New US Truck Inventories 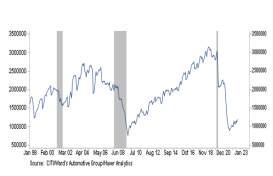
Source: Factset and Bloomberg through September 13, 2022. |
Note: Grey areas note recessions. Indices are unmanaged. An investor cannot invest directly in an index. They are shown for illustrative purposes only and do not represent the performance of any specific investment. Past performance is no guarantee of future results. Real results may vary.
What Will Happen to Corporate Profits?
Expectations for a more aggressive Fed in the face of lingering high prices is clearly a negative for future profits next year. Surging inventories reduce the need for new goods orders. A cooling job market will also pressure real demand. Even with inflation running higher than normal – which is supportive for nominal sales growth – falling volumes will pressure firms’ profitability per unit.
Corporations are fundamentally levered to the economy. Revenues, and to a lesser extent, profits can be buoyed by inflation, leading to relatively high nominal profit growth. In particular, large strategic companies have benefitted from superior industry positions and have thus been able to pass along rapidly rising costs to consumers. Persistently high inflation readings likely indicate that market leaders had successfully defended their margins. In inflationary periods like this one, inflation can appear as profit growth even when unit sales volumes decline.
The appearance of profit growth has limits, especially when pricing power is lost. As orders fall, production will have to slow. This will begin to impact labor demand in the manufacturing and construction sectors in 2023. This will have upstream impacts on marketing, sales and finance positions, as well as on advertising budgets. Margins in these environments always contract.
Late Warnings About Earnings Are Likely
Single stock analysts are unlikely to tell us of a coming earnings recession before top-down macro indicators do. Companies operating in the real economy have no expertise in macro forecasting, and so they are only going to tell us what they see on the ground right now. Sell-side analysts tend to follow corporate guidance, not lead it.
Estimates for 3Q have halved this summer, but it’s premature for operating profits to start falling outright in Q32022 when economic growth is still likely to be positive. However, as inflation and nominal growth falls, pricing power should abate, leading to lower top-line sales growth and also likely some degradation in margins. We would expect greater warnings about profits late in 2022.
What Will Happen to Investment in Capital Expenditure?
Business capital spending closely tracks both Commercial & Industrial (C&I) loans and non-financial profits. Higher rates during periods of falling demand means that investment is being squeezed. Banks are tightening their lending standards in making C&I loans. With the higher rate cycle shortened, the availability of loans is likely to fall even faster in 2023.
What Will Happen to Small Business Hiring?
There is a risk of a self-induced slowdown if everyone collectively believes there will be one. Small business expectations of economic growth remain near record lows. This should strongly impact small business hiring activity in the coming year, which typically represents the majority of new US hiring.
And What If the Fed Responds Slowly to All This?
If the Fed sees a recession and associated declines in employment, it would normally pivot and move to toward "accommodation." Yet, if inflation data have not turned decisively weaker when job losses are posted, the Fed could choose to react more slowly. The average contraction in employment has been trending longer in recent decades and is approaching a full year. A slow Fed response would indicate a lengthier recession once one begins.
An Investor’s Path Through Uncertain Times
Right now, the yield curve is telling us there is going to be a recession down the road. For the past 60 years, when the 1-year Treasury bill yield stays above the 10-year Treasury for a sustained period, it has accurately portended a recession 90% of the time.
If you knew for sure you were going to have a recession, you might think that selling stocks would be a good idea as losses would come quickly. Yet, it turns out that during pre-recessionary periods when the yield curve has been inverted, the US stock market has, on average, gone up by 3%. However, in the 6 and 12 months after a recession has begun, stock performance has been negative 5% and 3%, respectively, with a wide range of outcomes (see figure 5).
Figure 5: S&P 500 Returns When the Yield Curve Inverts: Pre- and Post-Recession
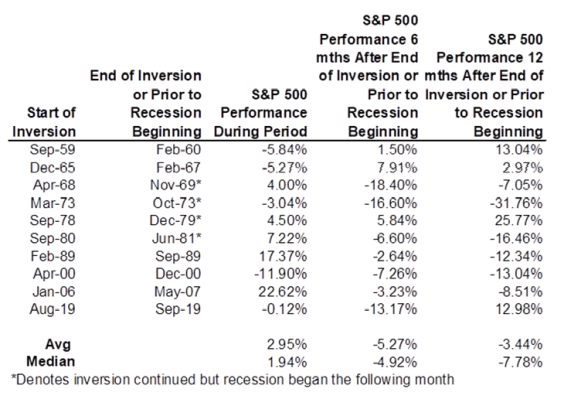
Source: Haver Analytics as of September 8, 2022. Indices are unmanaged. An investor cannot invest directly in an index. They are shown for illustrative purposes only and do not represent the performance of any specific investment. Past performance is no guarantee of future results. Real results may vary.
Pause Before Buying
Markets themselves are a leading indicator of profits in the economy. Despite present rosy EPS forecasts from analysts and strategists alike, the equity market decline of 2022 doesn’t speak much for confidence in the economy or profits in 2023 (see figure 6). That said, the actual declines in profits and employment have yet to begin. Actually discounting a recovery requires gauging the depths of the actual downturn and seeing the "building blocks" of recovery. While uncertain, we believe the chance is high that the economic "bottom" will become visible by the end of 2023.
Putting the forward outlook together along with the declines in equity markets to date, we continue to believe it is premature to buy cyclical assets on recovery prospects before the recession has yet to begin. In the meantime, investors need to husband their capital and take advantage of the sharply higher interest rates the Fed is providing (see figure 7).
|
Figure 6: S&P 500 (Leading 6 months) vs EPS Y/Y% 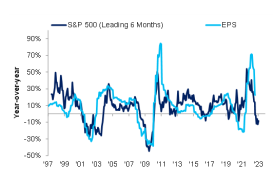
Source: Haver as of September 13, 2022. |
Figure 7: Short-Term US Investment Grade Yields 
Source: Haver as of September 13, 2022. |
Indices are unmanaged. An investor cannot invest directly in an index. They are shown for illustrative purposes only and do not represent the performance of any specific investment. Past performance is no guarantee of future results. Real results may vary. All forecasts are expressions of opinion and are subject to change without notice and are not intended to be a guarantee of future events. Past performance is not indicative of future returns. For illustrative purposes only.
In summary, even after 2022's global equity declines, we believe investors should tactically focus on reliable sources of return: sustainable dividend payouts from the highest quality industry leading firms and bond coupon income from strong investment grade issuers and governments. Evolving economic conditions and macro policies will alter this risk calculus to the investor’s favor over time (see our CIO Bulletin, Identifying Winners and Losers if the Fed Drives a Recession).
The CGWI Global Investment Committee (GIC) baseline portfolio allocations are as follows and reflect these defensive views (see the September Quadrant):
Figure 8: CGWI Global Investment Committee tactical asset allocation positions:Overweight US investment grade bonds and most consistent dividend growth equities
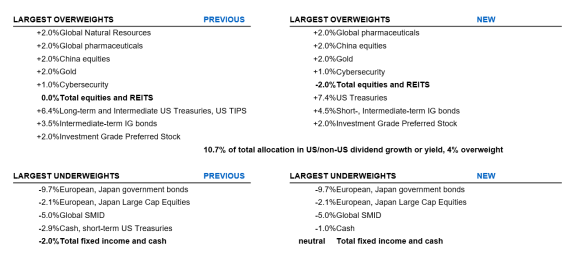
Source: OCIS as of September 14, 2022. All forecasts are expressions of opinion and are subject to change without notice and are not intended to be a guarantee of future events. Indices are unmanaged. An investor cannot invest directly in an index. They are shown for illustrative purposes only and do not represent the performance of any specific investment. Index returns do not include any expenses, fees or sales charges, which would lower performance. Past performance is no guarantee of future results. Real results may vary.
DISCLOSURES
This email contains promotional materials. If you do not wish to receive any further promotional emails from Citi Global Wealth Investments, please email donotspam@citi.com with "UNSUBSCRIBE" in the subject line. Email is not a secure environment; therefore, do not use email to communicate any information that is confidential such as your account number or social security number.
This Communication is prepared by Citi Global Wealth Investments ("CGWI") which is comprised of the Investments and Capital Markets capabilities of Citi Private Bank, Citi Personal Wealth Management and International Personal Bank U.S.
Citi Private Bank and Citi Personal Wealth Management are businesses of Citigroup Inc. ("Citigroup"), which provide clients access to a broad array of products and services available through bank and non-bank affiliates of Citigroup. Not all products and services are provided by all affiliates or are available at all locations. In the U.S., investment products and services are provided by Citigroup Global Markets Inc. ("CGMI"), member FINRA and SIPC, and Citi Private Advisory, LLC ("Citi Advisory"), member FINRA and SIPC. CGMI accounts are carried by Pershing LLC, member FINRA, NYSE, SIPC. Citi Advisory acts as distributor of certain alternative investment products to clients of Citi Private Bank. Insurance is offered by Citi Personal Wealth Management through Citigroup Life Agency LLC ("CLA"). In California, CLA does business as Citigroup Life Insurance Agency, LLC (license number 0G56746). CGMI, Citi Advisory, CLA and Citibank, N.A. are affiliated companies under the common control of Citigroup. Outside the U.S., investment products and services are provided by other Citigroup affiliates. Investment Management services (including portfolio management) are available through CGMI, Citi Advisory, Citibank, N.A. and other affiliated advisory businesses. These Citigroup affiliates, including Citi Advisory, will be compensated for the respective investment management, advisory, administrative, distribution and placement services they may provide.
International Personal Bank U.S. ("IPB U.S."), is a business of Citigroup which provides its clients access to a broad array of products and services available through Citigroup, its bank and non-bank affiliates worldwide (collectively, "Citi"). Through IPB U.S. prospects and clients have access to the Citigold® Private Client International, Citigold® International, International Personal, Citi Global Executive Preferred, and Citi Global Executive Account Packages. Investment products and services are made available through Citi Personal Investments International ("CPII"), a business of Citigroup which offers securities through CGMI, member FINRA and SIPC, an investment advisor and broker–dealer registered with the Securities and Exchange Commission. CGMI investment accounts are carried by Pershing LLC, member FINRA, NYSE, and SIPC. Insurance is offered by CPII through CLA. In California, CLA does business as Citigroup Life Insurance Agency, LLC (license number 0G56746). Citibank N.A., CGMI, and CLA are affiliated companies under common control of Citigroup Inc.
Read additional Important Information
Past performance is not indicative of future results. Real results may vary.
Citi and its employees are not in the business of providing, and do not provide, tax or legal advice to any taxpayer outside Citi. Any statement in this Communication regarding tax matters is not intended or written to be used, and cannot be used or relied upon, by any taxpayer for the purpose of avoiding tax penalties. Any such taxpayer should seek advice based on the taxpayer’s particular circumstances from an independent tax advisor.
MBS are also sensitive to interest rate changes which can negatively impact the market value of the security. During times of heightened volatility, MBS can experience greater levels of illiquidity and larger price movements.
Important information, including information relating to risk considerations can be found in the link above.
Views, opinions and estimates expressed herein may differ from the opinions expressed by other Citi businesses or affiliates, and are not intended to be a forecast of future events, a guarantee of future results, or investment advice, and are subject to change without notice based on market and other conditions. Citi is under no duty to update this presentation and accepts no liability for any loss (whether direct, indirect or consequential) that may arise from any use of the information contained in or derived from this presentation.
© 2021 Citigroup Inc., All Rights Reserved. Citi, Citi and Arc Design and other marks used herein are service marks of Citigroup Inc. or its affiliates, used and registered throughout the world.


FLOYD VENTURES
2525 Ridgmar Blvd., Suite 334
Fort Worth, TX 76116
817.332.6400
2016© Floyd Ventures All rights reserved